Revenue is the number small business owners most closely watch. It is also the number that tells buyers the least.
A small business KPI (key performance indicator) dashboard is a single view of the operational metrics that buyers and lenders examine during due diligence, which is the buyer’s formal investigation of your business before a sale closes. Revenue tells them what you earned. These key metrics tell them how well you run the place. Seven numbers do most of the work: revenue, jobs completed, average ticket, close rate, callback rate, AR (accounts receivable) aging, and gross margin. Update them weekly. Owners who track these business KPIs before going to market enter negotiations with more leverage, shorter due diligence timelines, and stronger offers. A spreadsheet is all it takes to start.Why Buyers Care About Your KPI Dashboard
When a buyer looks at your KPI dashboard, they are not just checking numbers. They are forming a judgment about how you run your business and whether it will keep running without you. A company tracking five or more metrics consistently signals discipline. A company with nothing tracked signals the opposite, and buyers will wonder what other gaps exist. During due diligence, buyers focus on three things in your reporting:- Which metrics you track: Revenue alone does not answer the questions buyers ask. They want operational indicators that point toward future performance, not just last year’s results.
- How often you update them: Monthly updates are the floor. Weekly updates score higher with serious buyers. Real-time dashboards, while not required, signal a more sophisticated operation.
- How long your history runs: Twelve months of consistent KPI data is the minimum a buyer expects. Twenty-four months gives them much more to work with.
The 7 Essential KPIs for Business Sale Readiness
Most buyers evaluating small businesses in the $1M to $5M revenue range look at the same core set of metrics. These seven cover your business’s health across net sales, operations, service quality, and gross margin. Together, they give buyers the complete picture they need to move forward with confidence.| KPI | What It Measures | Why Buyers Care |
|---|---|---|
| Revenue | Total sales per period | Growth trajectory and stability |
| Jobs Completed | Volume of work delivered | Capacity and demand signals |
| Average Ticket | Revenue per job or transaction | Pricing power and customer mix |
| Close Rate | Percentage of leads converted | Sales process effectiveness |
| Callback Rate | Service callbacks within 30 days as a percentage of completed jobs (a defect metric, target below 3%) | Service quality and rework risk |
| AR Over 30 Days | Receivables aging past 30 days | Cash flow risk and collection discipline |
| Gross Margin | Revenue minus direct costs, divided by revenue (a percentage, not a dollar amount) | Profitability before overhead |
Start here. Add more specific metrics only after you have consistently tracked these seven for at least 3 months.
One number deserves extra attention: AR over 30 days. When receivables climb, buyers read it as a cash flow problem waiting to happen. If your AR aging is trending in the wrong direction, fix your collection process before you list. Do not wait for a buyer to bring it up first.How to Build Your Dashboard in 30 Minutes
You do not need to buy anything. A free tool like Google Sheets is a perfectly functional KPI dashboard template, and it is where most small business owners should start their performance tracking.- Step 1: Create seven columns. Label one for each KPI above. Add a date column on the far left.
- Step 2: Add one row per week. Enter your numbers every Monday morning. Consistency here is the whole point. Buyers want to see a cadence, not a scramble.
- Step 3: Add conditional formatting. Red for any metric below target. Green for anything above. This simple visual layer makes it easy to display KPI trends without digging through rows of data.
- Step 4: Build a trend chart. Select your data range and insert a line chart. Twelve weeks of entries produce the kind of visual pattern buyers actually review during due diligence.
- Step 5: Assign a dashboard owner. This is the step most owners skip. Do not manage this yourself. Hand it to an operations manager or office manager. Buyers want to see a system that runs on its own, not one that depends on the owner showing up every Monday.
How Buyers Score Your Reporting Discipline
The rubric below is a practical guide based on how experienced buyers and advisors typically assess reporting quality. Where your business lands on this scale can affect your sale price, your negotiating position, and the duration of due diligence.| Your Reporting Level | What It Signals | Score |
|---|---|---|
| No KPIs tracked, or reporting lag over 21 days | Poor management visibility | 1 out of 5 |
| Some KPIs tracked, 11 to 21-day reporting lag | Baseline discipline, room to improve | 3 out of 5 |
| Five or more KPIs tracked consistently, lag under 10 days | Strong operational management | 5 out of 5 |
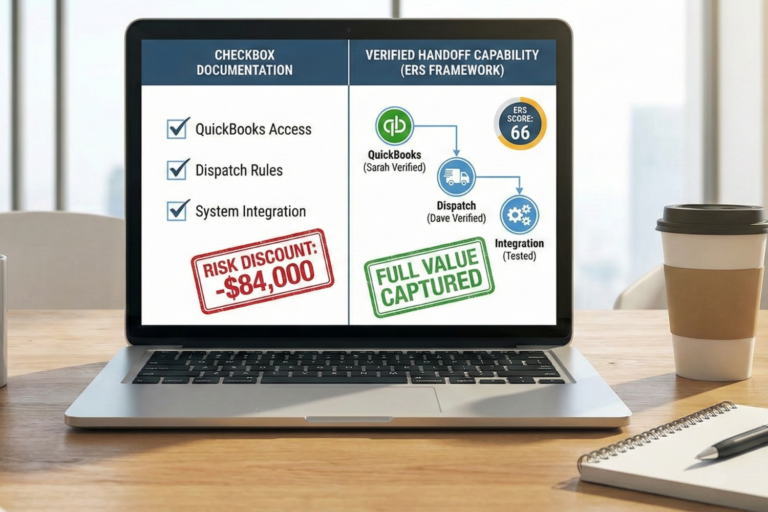
A Score 1 business is a harder sell in every sense. Buyers negotiate more aggressively, offer lower multiples (the number your earnings are multiplied by to determine your sale price), and take longer to close because they cannot trust what you tell them without verifying everything themselves.
A Score 5 business is a different conversation. Structured KPI data lets buyers make informed, data-driven decisions faster. That kind of business intelligence reduces their risk, and buyers will pay more for a business that removes uncertainty.Common Mistakes That Lower Your Score
The same five problems keep popping up when small business owners build their first KPI dashboard. Each one is fixable, but they cost real money when left unaddressed and go into a sale.- Tracking too many metrics: Fifteen KPIs do not signal rigor. They signal confusion. Start with five to seven relevant metrics. Cut anything that looks good on paper but does not drive informed decisions. Those are your vanity metrics. Add more only after the core set has been running consistently for three months.
- Letting the owner run the dashboard: If you are the one entering numbers, updating charts, and generating KPI reports, buyers see that as a risk. When you leave, the system leaves with you. Hand this off to a team member before you start the sale process.
- Updating monthly instead of weekly: Monthly reporting is not disqualifying, but it scores lower. The difference between a 3 and a 5 on the reporting rubric is often just 10 minutes a week. Ten extra minutes a week is a small price to pay for a better score.
- Ignoring the trend line: A single data point tells buyers almost nothing. Twelve or more weeks of KPI tracking reveal patterns, and it’s those patterns that buyers are really looking for. Start now, even if the numbers are not perfect yet.
- Not fixing negative trends before listing: A rising AR aging figure or a declining close rate does not disappear because you hope a buyer will not notice. They will notice. Fix the underlying problem first. If you cannot fix it in time, document the explanation so you control the narrative.
Your Next Step Toward a Stronger Sale
Building a small business KPI dashboard does not require expensive software or a dedicated analyst. Pick the seven metrics above, open a spreadsheet, and start entering numbers this week. Delegate the updates to a team member and commit to a weekly cadence. Twelve months from now, you will have the reporting history that buyers and SBA lenders look for, and the negotiating position that comes with it. Use the Exit Readiness Score assessment to see how your KPI tracking fits into your broader exit preparation across systems, financials, team, and owner readiness. The SBA’s guide to selling a small business covers the full process if you want the wider picture. Start today. The data you build now is the leverage you carry into every conversation with a buyer.Frequently Asked Questions
Which KPIs should a small business track before selling?
The seven essential KPIs to track before selling are revenue, jobs completed, average ticket, close rate, callback rate, AR aging, and gross margin.
How often should you update a KPI dashboard?
Update your KPI dashboard weekly for the strongest buyer signal; monthly updates are the minimum, but score lower during due diligence.
Do you need KPI dashboard software to track business metrics?
No, a free tool like Google Sheets works well as a starting KPI dashboard template, though dedicated KPI tools like Power BI offer more advanced visual dashboards for businesses managing complex data sources.
How does KPI tracking affect a business sale?
Consistent KPI tracking over 12 or more months signals operational discipline to buyers and lenders, which can shorten due diligence timelines and support a stronger sale price.
What happens if you do not track KPIs before selling your business?
If you do not track KPIs consistently, buyers may see your business as higher risk, which can lead to lower offers, longer due diligence timelines, and more negotiation pressure.
References
Carbajo, M. (2019, April 18). Top 10 business credit terms small business owners should know. U.S. Small Business Administration. https://www.sba.gov/blog/top-10-business-credit-terms-small-business-owners-should-know
U.S. Small Business Administration. (n.d.). Loans. https://www.sba.gov/funding-programs/loans
U.S. Small Business Administration. (n.d.). Plan your business. https://www.sba.gov/business-guide/plan-your-business
U.S. Small Business Administration. (2026, January 26). Close or sell your business. https://www.sba.gov/business-guide/manage-your-business/close-or-sell-your-business